 Urban
Urban
Warming
ARE LARGE CITIES WARMING FASTER THAN THE PLANET AS A WHOLE?
OVERVIEW
How rapidly are large cities in the United States warming? This question is important for two reasons. First, extreme temperatures are responsible for more annual fatalities than all other forms of extreme weather combined, including earthquakes, tornadoes, and hurricanes. In a warming world, the public health threats of extreme heat are expected to intensify. Second, annual analyses of mean global temperature change omit urban weather station data, as urban temperature trends are known to reflect both background warming rates and localized warming anomalies, such as the urban heat island effect. As a result, global estimates of climate change are likely to underestimate rates of warming in the very places where most of the global population now resides: cities.
Through this study we analyzed five decades of meteorological observations recorded by weather stations located within and in proximity to 50 of the most populous U.S. cities to measure the rate of change in “urban heat island” intensity – localized hotspots created by urban infrastructure and waste heat emissions – in each decade between 1951 and 2000.
To measure historic rates of change in urban heat islands, we identified three rural weather stations in proximity to each city, based on the intensity of night light associated with each station, as recorded by a satellite radiometer. Average rural temperature trends were then subtracted from the annual average temperature of an urban weather station to compute heat island intensity.
The results of this analysis, averaged by decade for each city, are reported in Figure 1. Red circles in the figure denote regions in which urban stations are warming more rapidly than rural stations, while blue circles denote regions in which rural weather stations tend to be warming more rapidly than urban stations. On average, the heat islands of the most populous U.S. cities increased during this period at a rate of 0.5 C per century, suggesting an increase in the rate of urban warming more than 30% greater than the rate of rural, background warming. For those cities experiencing growth in heat islands over time (red circles), the average rate of urban warming was about 2 C per century (Figure 2). This finding suggests that, if historical rates of temperature change continue through the present century, growth in the urban heat island effect of warming cities will amplify background rates of global warming by an average of 150% (Figure 3).
These findings suggest that the actual magnitude of warming in urban areas is likely to be much greater than that forecast by the Intergovernmental Panel on Climate Change (IPCC), greatly elevating the need for climate-responsive design strategies to counteract the enhanced impacts of warming in large cities.
The complete results of this study are reported in the International Journal of Climatology (Vol 27: 1801-1807).
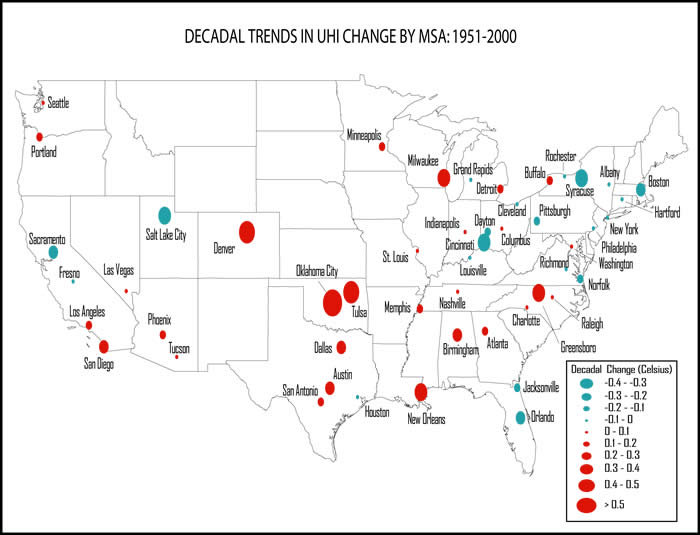
FIGURE 1
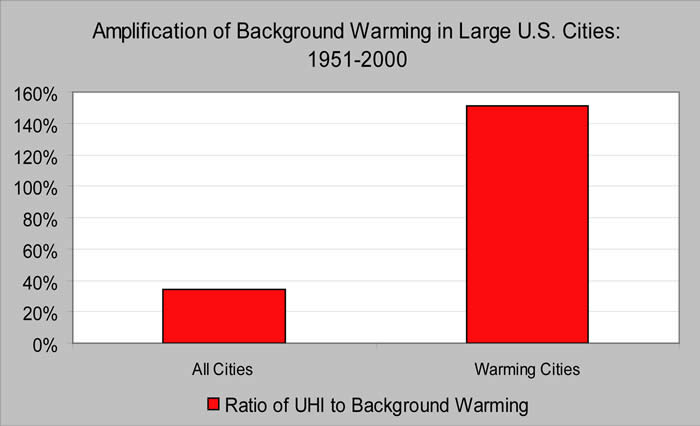
FIGURE 2